![]()
|
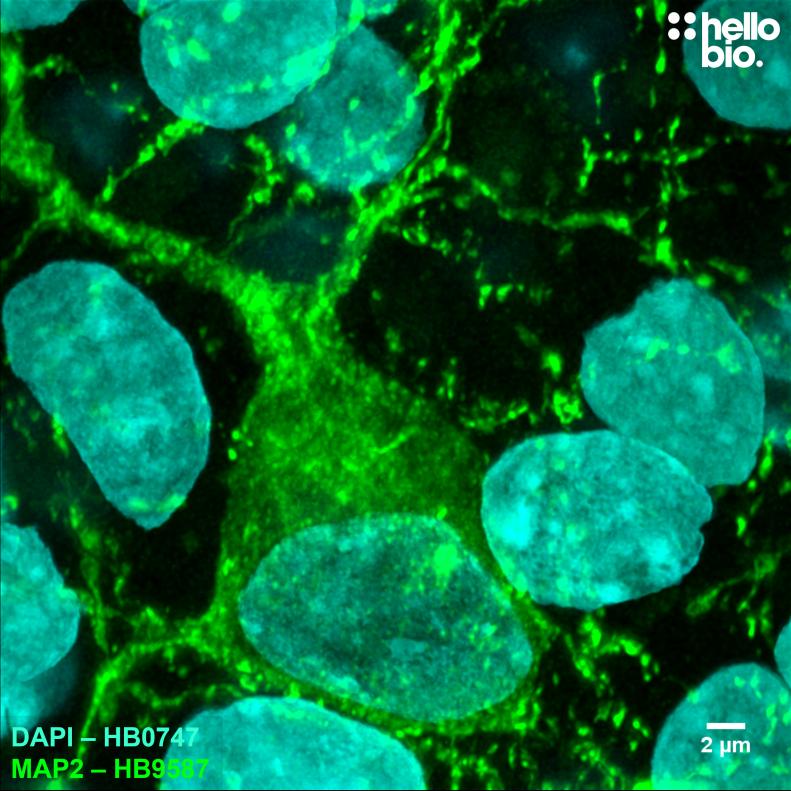
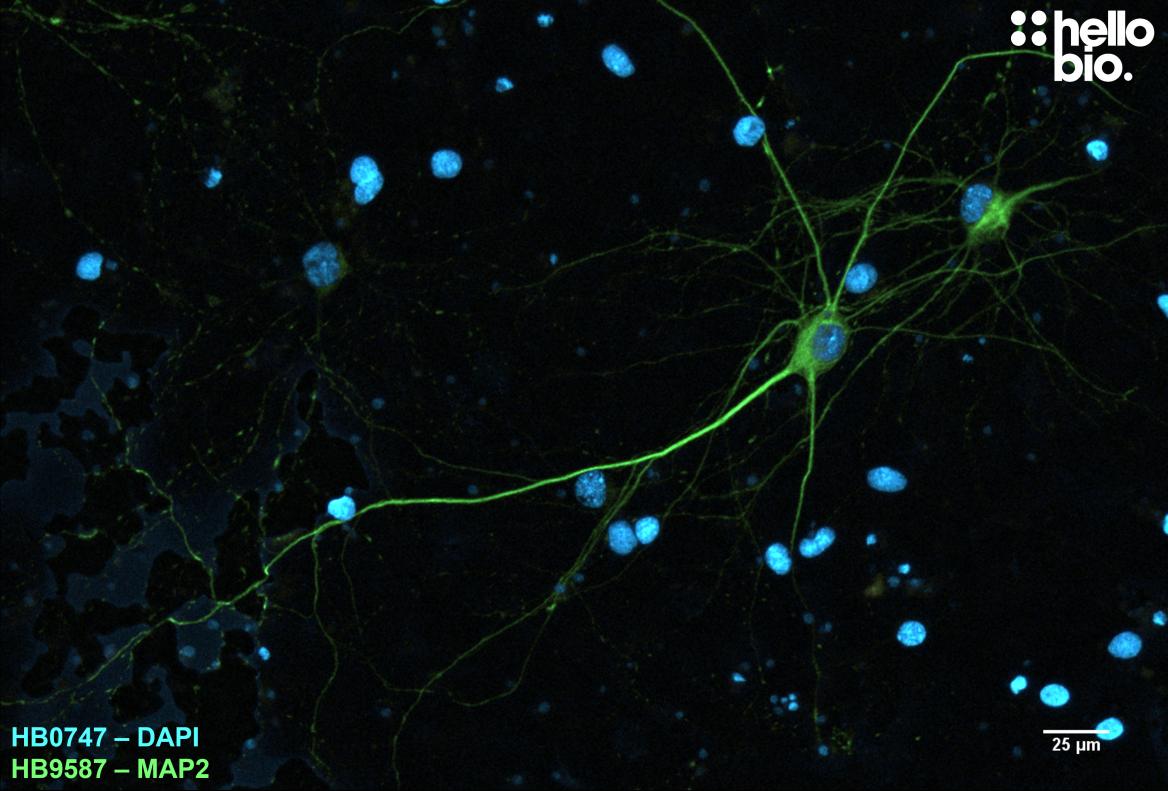
Figure 1. MAP2 expression in cultured rat neurones visualised using HB9587. HB9587 visualised the cell body, dendrites and axon of a cultured neurone. Method: neurones were cultured from PND2 rats following established protocols (Brewer and Torricelli, 2007. Nat Protoc 2, 1490–1498) and fixed with 4% PFA on DIV21. Cells were permeabilised with 0.1% Triton X-100 followed by blocking in 1% BSA, 300mM glycine. HB9587 was incubated overnight (4°C) at a 1:500 dilution (2µg/ml) followed by a one hour incubation with secondary antibody (Polyclonal goat anti-mouse DyLight 488 conjugated, Thermofisher 35503, 1:300 dilution). DAPI (HB0747) was used at 1µg/ml to visualise cell nuclei. For more detail please see our ICC protocol. Images were captured using a Leica SPE confocal laser scanning microscope coupled to a Leica DMi8 inverted epifluorescence microscope. The image was captured using a 63x objective (4.35x zoom), 405nm (45.6% power) and 488nm (31.2% power) laser lines in a z-stack (0.335 µm spacing). Deconvolution was carried out using Huygens Essential (Scientific Volume Imagine) followed by the stack being flattened using a maximum Z projection in ImageJ (Schindelin et al., 2012. Nat Methods, 9(7), 676–682). |
![]()
|
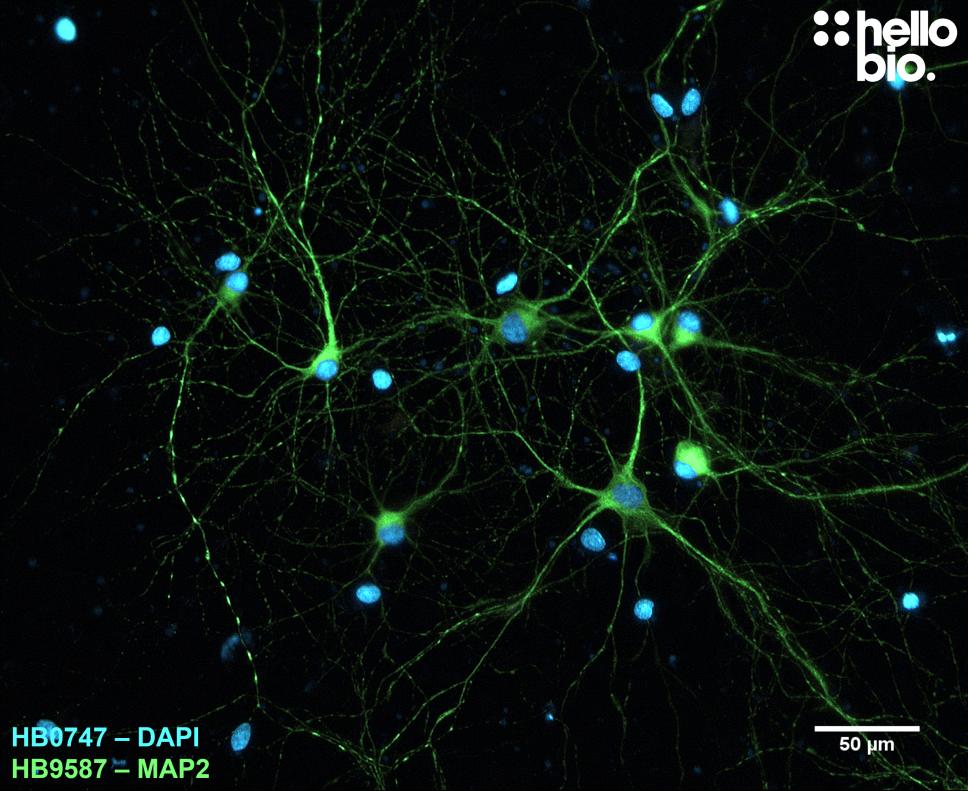
Figure 2. MAP2 expression in cultured rat neurones visualised using HB9587. HB9587 visualised the a dense network of culture neurones. Method: neurones were cultured from PND2 rats following established protocols (Brewer and Torricelli, 2007. Nat Protoc 2, 1490–1498) and fixed with 4% PFA on DIV21. Cells were permeabilised with 0.1% Triton X-100 followed by blocking in 1% BSA, 300mM glycine. HB9587 was incubated overnight (4°C) at a 1:500 dilution (2µg/ml) followed by a one hour incubation with secondary antibody (Polyclonal goat anti-mouse DyLight 488 conjugated, Thermofisher 35503, 1:300 dilution). DAPI (HB0747) was used at 1µg/ml to visualise cell nuclei. For more detail please see our ICC protocol. Images were captured using a Leica SPE confocal laser scanning microscope coupled to a Leica DMi8 inverted epifluorescence microscope. The image was captured using a 40x objective (1x zoom), 405nm (45.6% power) and 488nm (31.2% power) laser lines in a z-stack (0.43 µm spacing). Deconvolution was carried out using Huygens Essential version (Scientific Volume Imagine) followed by the stack being flattened using a maximum Z projection in ImageJ (Schindelin et al., 2012. Nat Methods, 9(7), 676–682). |
![]()
|
Figure 3. MAP2 expression in cultured rat neurones visualised using HB9587. HB9587 visualised the a dense network of culture neurones. Method: neurones were cultured from PND2 rats following established protocols (Brewer and Torricelli, 2007. Nat Protoc 2, 1490–1498) and fixed with 4% PFA on DIV21. Cells were permeabilised with 0.1% Triton X-100 followed by blocking in 1% BSA, 300mM glycine. HB9587 was incubated overnight (4°C) at a 1:1000 dilution (1µg/ml) followed by a one hour incubation with secondary antibody (Polyclonal goat anti-mouse DyLight 488 conjugated, Thermofisher 35503, 1:300 dilution). DAPI (HB0747) was used at 1µg/ml to visualise cell nuclei. For more detail please see our ICC protocol. Images were captured using a Leica DM2500 epifluorescence microscope (20x objective) coupled to a Leica DFC7000T colour digital camera with DAPI LP (3.4x gain, 36.2ms exposure) and I3 (3.4x gain, 150ms exposure) filters. The image was processed in ImageJ (Schindelin et al., 2012. Nat Methods, 9(7), 676–682) using the subtract background (50px rolling ball radius) tool. |
![]()
|
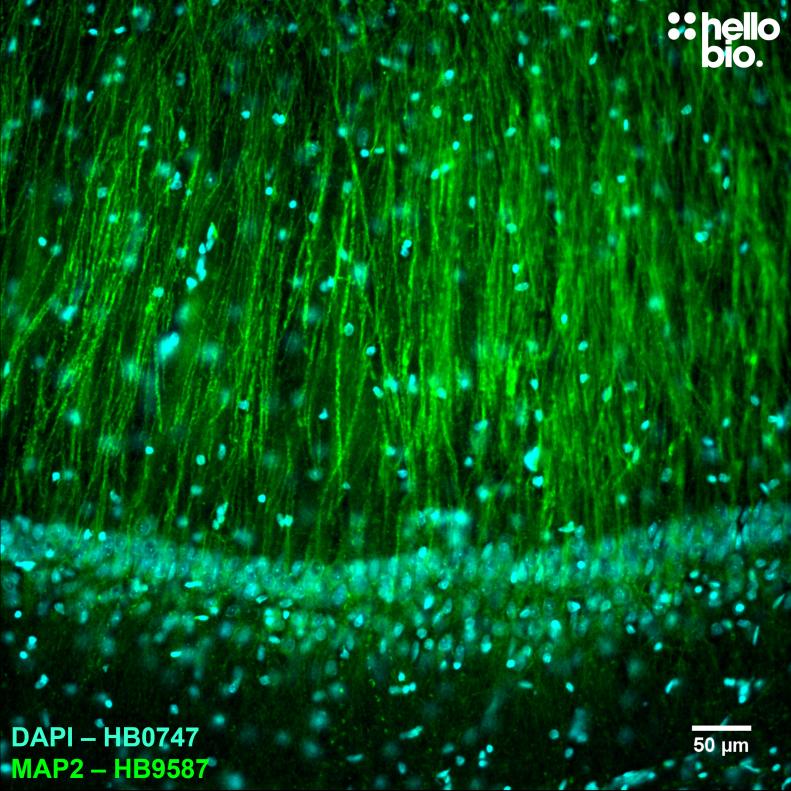
Figure 4. MAP2 expression in rat CA1 pyramidal neurones visualised using HB9587. HB9587 visualised the dense network of pyramidal neurone dendrites alongside interneurons of the stratum radiatum of CA1. Method: hippocampi were dissected from rat brains and fixed overnight in 4% PFA before then being incubated in 30% sucrose (in PBS) for another 24hrs. A freezing microtome was used to cut 40µm transverse slices before sections were incubated in 0.05M glycine for 30 minutes. Section were blocked in 1% BSA, 22.52mg/ml glycine before incubation overnight in HB9587 (1:1000 dilution, 1µg/ml). This was followed by a two hour incubation with secondary antibody (Polyclonal goat anti-mouse DyLight 488 conjugated, Thermofisher 35503, 1:300 dilution). DAPI (HB0747) was used at 1µg/ml to visualise cell nuclei. For more detail please see our IHC(IF) protocol. Images were captured using a Leica DMI6000B inverted epifluorescence microscope (20x objective) coupled to a Photometric-Prime95B monochrome digital camera with DAPI (10.2ms exposure) and L5 (112.7ms exposure) filters. The image was processed in ImageJ (Schindelin et al., 2012. Nat Methods, 9(7), 676–682) using the subtract background (50px rolling ball radius) tool. |
![]()
|
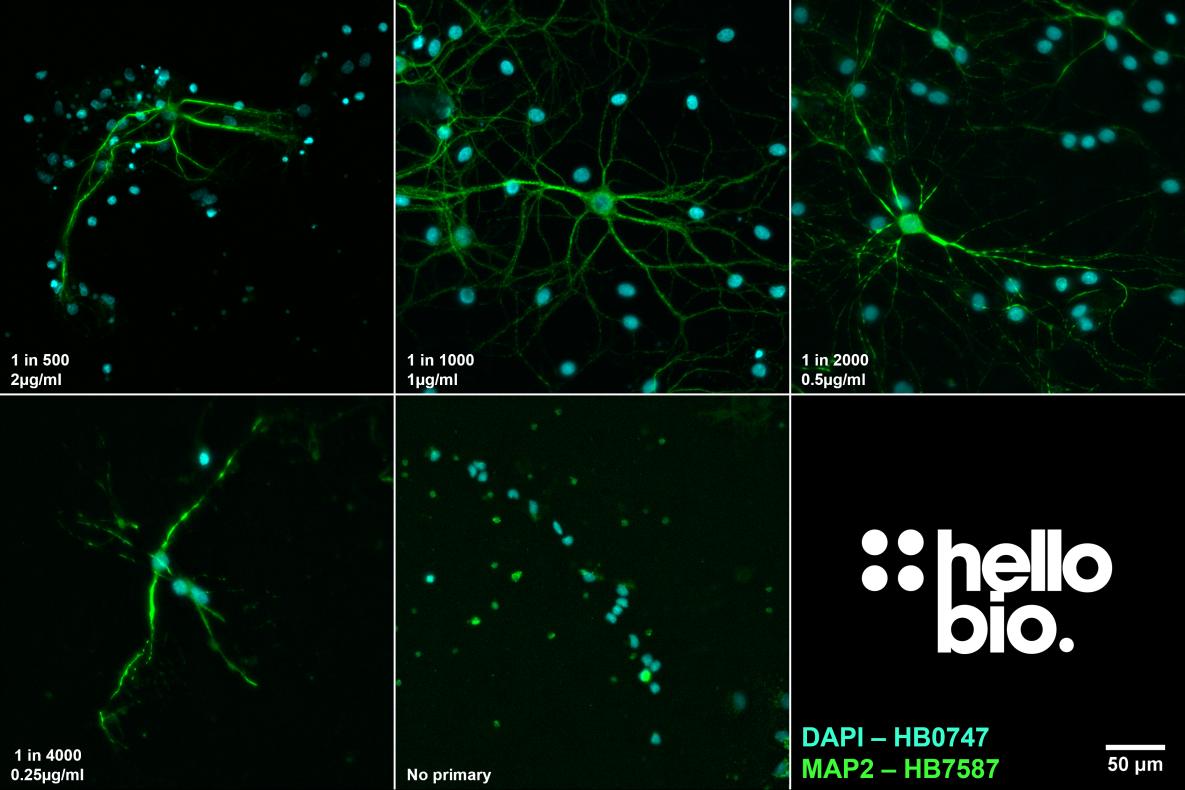
Figure 5. The effect of varying HB9587 concentration upon staining in cultured rat neurones. HB9587 produced a strong signal to noise ratio at dilutions as low as 1in2000 (500 ng/ml). Method: neurones were cultured from PND2 rats following established protocols (Brewer and Torricelli, 2007. Nat Protoc 2, 1490–1498) and fixed with 4% PFA on DIV21. Cells were permeabilised with 0.1% Triton X-100 followed by blocking in 1% BSA, 300mM glycine. HB9587 was incubated overnight (4°C) at dilutions ranging from 1:500 (2µg/ml) to 1:4000 (0.25µg/ml) with a no primary step omitting the addition of HB9587 to the incubation buffer. This was followed by a one hour incubation with secondary antibody (Polyclonal goat anti-mouse DyLight 488 conjugated, Thermofisher 35503, 1:300 dilution). DAPI (HB0747) was used at 1µg/ml to visualise cell nuclei. For more detail please see our ICC protocol. Images were captured using a Leica DM2500 epifluorescence microscope (20x objective) coupled to a Leica DFC7000T colour digital camera with DAPI and G/R filters. Exposure times were as follows:
1:500 – DAPI 56.6ms exposure, G/R 71.2ms exposure (captured on a different microscope – Leica DMI6000B, 40x objective, Photometric-Prime95B monochrome camera).
1:1000 – DAPI 1x gain, 43.7ms exposure, G/R 4.4x gain, 177.4ms exposure
1:2000 – DAPI 1x gain, 46.5ms exposure, G/R 4.5x gain, 210.3ms exposure
1:4000 – DAPI 1x gain, 40.0ms exposure, G/R 5.4x gain, 471.4ms exposure
No primary – DAPI: 10.18ms exposure, I3: 112.ms exposure (taken using different microscope: Leica DMI6000B with Photometric-Prime95B camera).
Images were processed in ImageJ (Schindelin et al., 2012. Nat Methods, 9(7), 676–682) using the subtract background (50px rolling ball radius) tool followed by stacking and montage creation. |
![]()
|
Figure 6. MAP2 expression in cultured rat neurones visualised using HB9587. HB9587 visualising a cultured rat neurone. Method: neurones were cultured from PND2 rats following established protocols (Brewer and Torricelli, 2007. Nat Protoc 2, 1490–1498) and fixed with 4% PFA on DIV21. Cells were permeabilised with 0.1% Triton X-100 followed by blocking in 1% BSA, 300mM glycine. HB9587 was incubated overnight (4°C) at a 1:1000 dilution (1µg/ml) followed by a one hour incubation with secondary antibody (Polyclonal goat anti-mouse DyLight 488 conjugated, Thermofisher 35503, 1:300 dilution). DAPI (HB0747) was used at 1µg/ml to visualise cell nuclei. For more detail please see our ICC protocol. Images were captured using a Leica DM2500 epifluorescence microscope (20x objective) coupled to a Leica DFC7000T colour digital camera with DAPI LP (5.9x gain, 40.0ms exposure) and I3 (5.9x gain, 146.0ms exposure) filters. The image was processed in ImageJ (Schindelin et al., 2012. Nat Methods, 9(7), 676–682) using the subtract background (50px rolling ball radius) tool. |
![]()
|
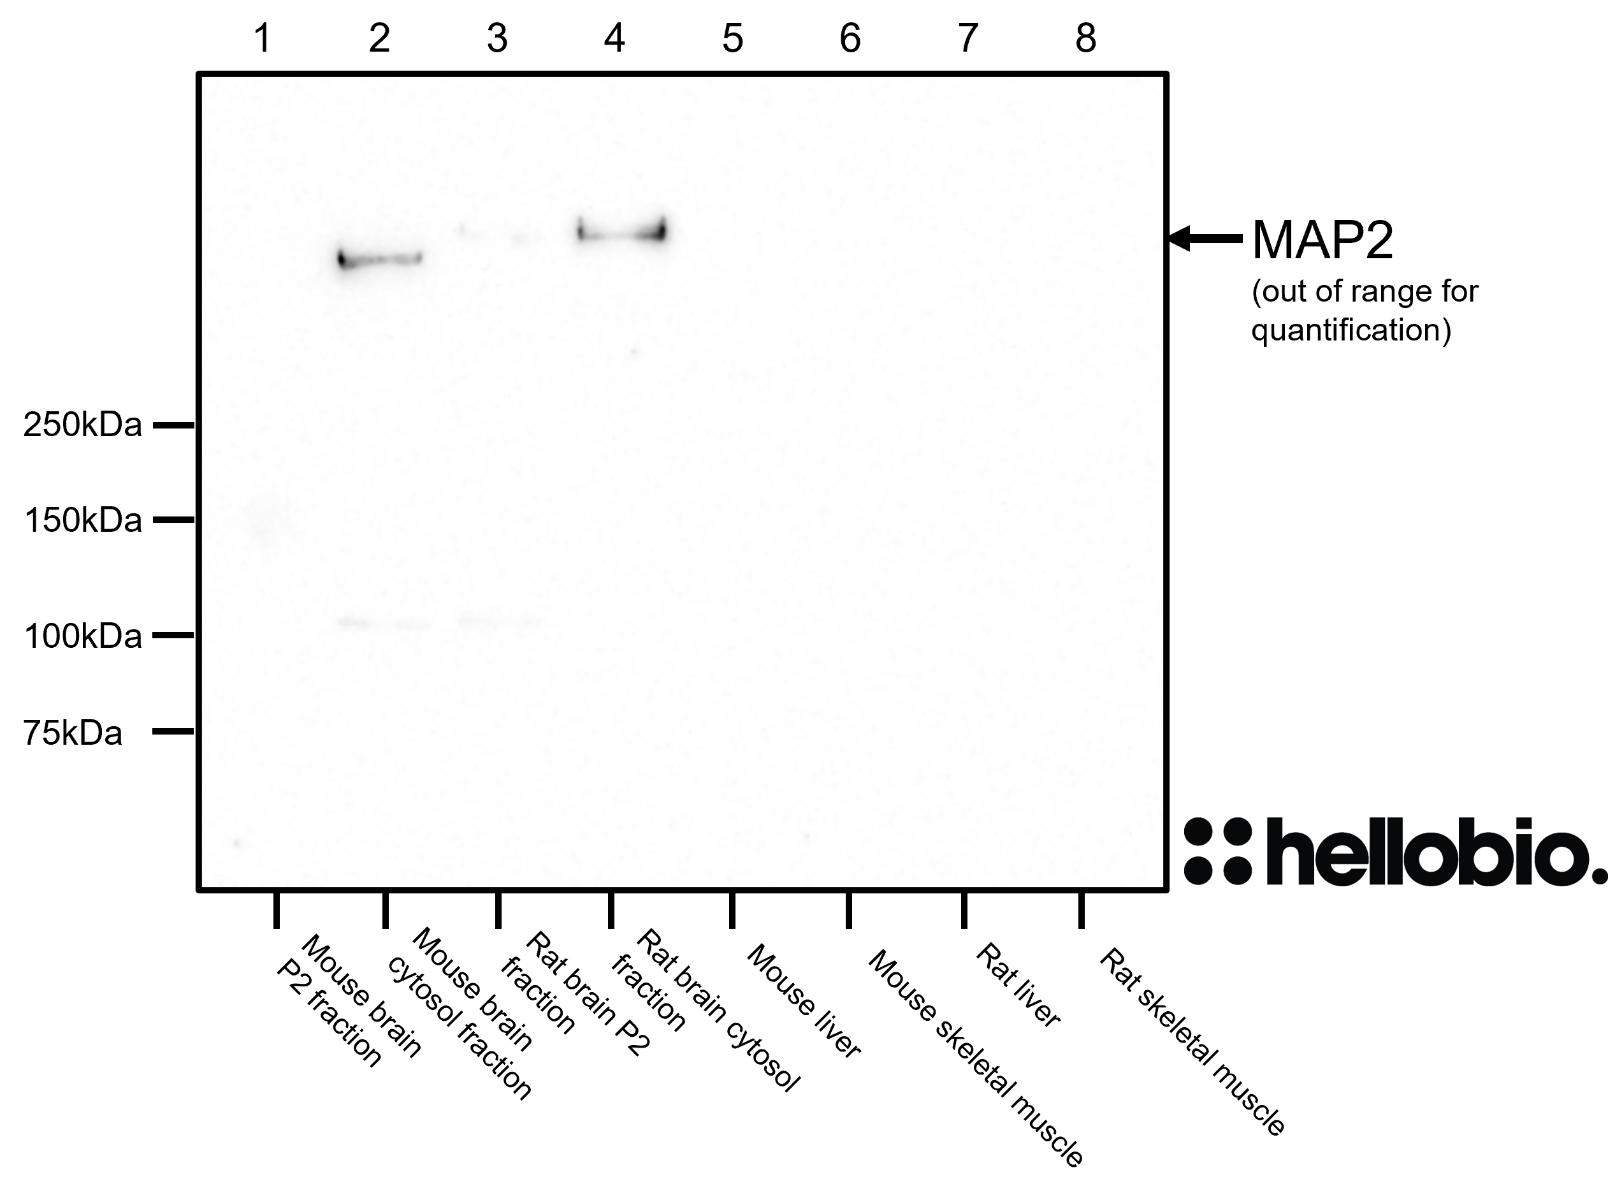
Figure 7. MAP2 expression in various tissue lysates and preparations. HB9587 revealed a band of size greater than 250kDa only present in brain cytosol fractions. Method: mouse brain and rat brain membrane (P2) and cytosol fractions were prepared following previous work (Molnar et al., 1993. Neuroscience 53:307-326) from freshly collected adult brains. Other tissue lysates were prepared following established protocols from freshly dissected tissue (see our guide on WB sample preparation). Samples were loaded (20µg / lane) onto a 5% acrylamide gel alongside a protein ladder (BioRad Precision Plus dual colour, 1610374) before being run at 60V for 41 minutes followed by 120V for 85 minutes. Wet transfer to a PVDF membrane was completed in 93 minutes using 400mA. The membrane was blocked for 2hrs in 5% non-fat dry milk before being incubated overnight at 4°C in HB9587 at a 1:1000 dilution (1µg/ml). Following washing the membrane was incubated in secondary antibody (1:10,000 dilution, Polyclonal goat anti-mouse HRP conjugated, Sigma Aldrich A3682) for 2hrs. For more detail please see our Western blotting protocol. Detection was accomplished using Clarity Western ECL substrate (BioRad, 1705061) and a Licor Odyssey Fc imaging system (ECL channel: 10 min exposure, 700nm channel: 30 sec exposure). |
![]()
|
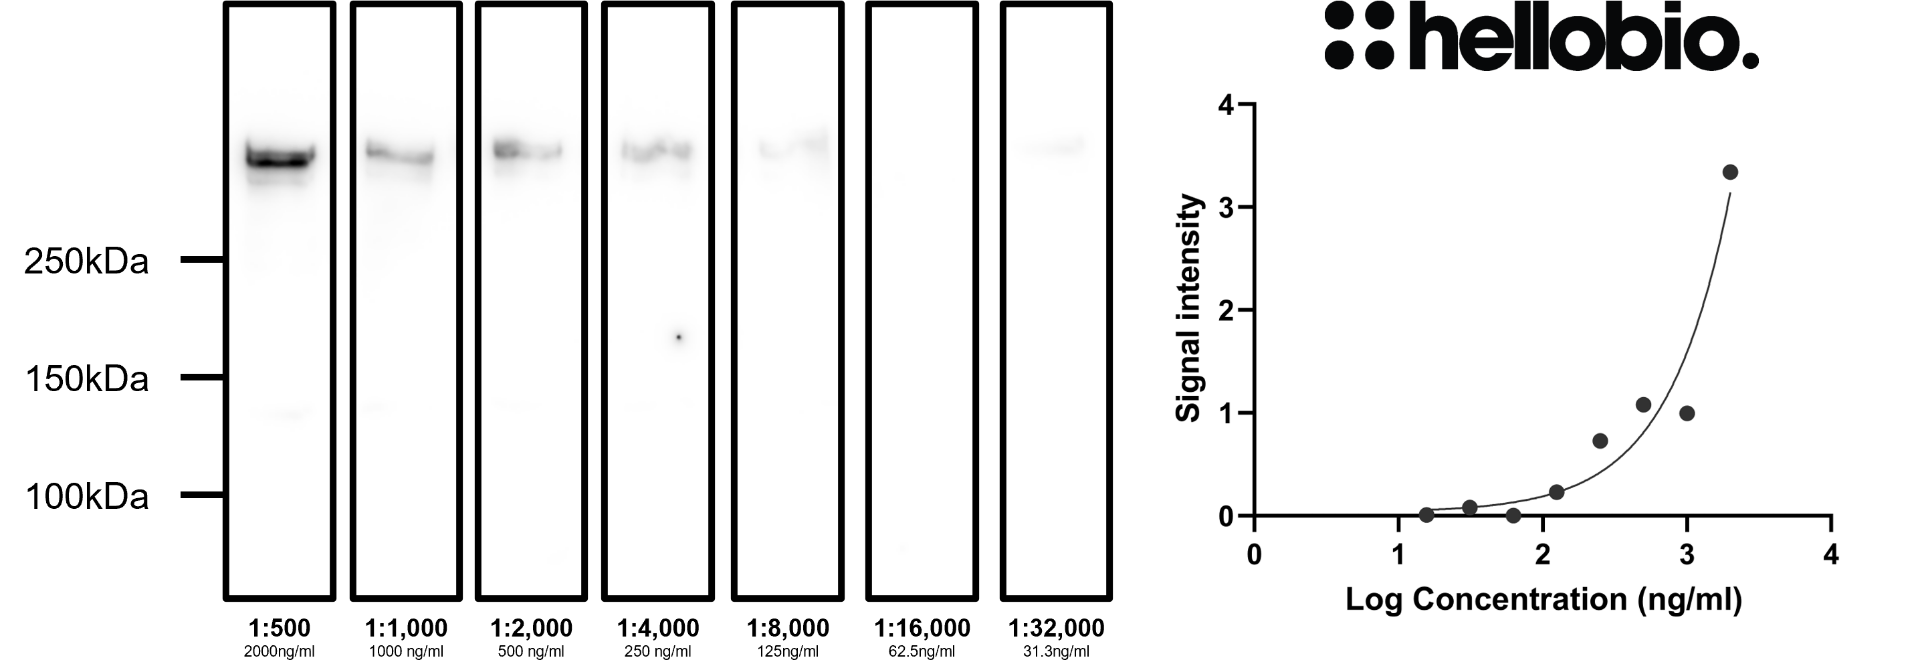
Figure 8. Concentration response of HB9587 staining in a rat brain cytosol preparation. HB9587 shows consistent results with low background at dilutions as low as 1:4,000 (250 ng/ml). Method: cytosol fractions were prepared from fresh rat brains following established protocols (Molnar et al., 1993. Neuroscience 53:307-326). Rat cytosol samples were loaded (20µg / lane) onto a 5% acrylamide gel alongside a protein ladder (BioRad Precision Plus dual colour, 1610374) before being run at 60V for 30 minutes followed by 120V for 90 minutes. Wet transfer to a PVDF membrane was completed in 90 minutes using 400mA. Following transfer the membrane was cut into strips using Ponceau dye to visualise and cut individual lanes. Strips were blocked for 2hrs in 5% non-fat dry milk before being incubated overnight at 4°C in HB9587. Each strip was incubated separately with a separate HB9587 concentration with this ranging from 2µg/ml (1:500 dilution) to 31.3ng/ml (1:32,000 dilution). Following washing the membrane was incubated in secondary antibody (1:10,000 dilution, Polyclonal goat anti-mouse HRP conjugated, Sigma Aldrich A3682) for 2hrs. For more detail please see our Western blotting protocol. Detection was accomplished using Clarity Western ECL substrate (BioRad, 1705061) and a Licor Odyssey Fc imaging system (ECL channel: 10 min exposure, 700nm channel: 30 sec exposure). Band intensity was calculated using Image Studio version 5.2.5 (LiCor) and a graph was constructed in GraphPad Prism 9 using a 3-parameter Hill equation curve fit. |
![]()
|
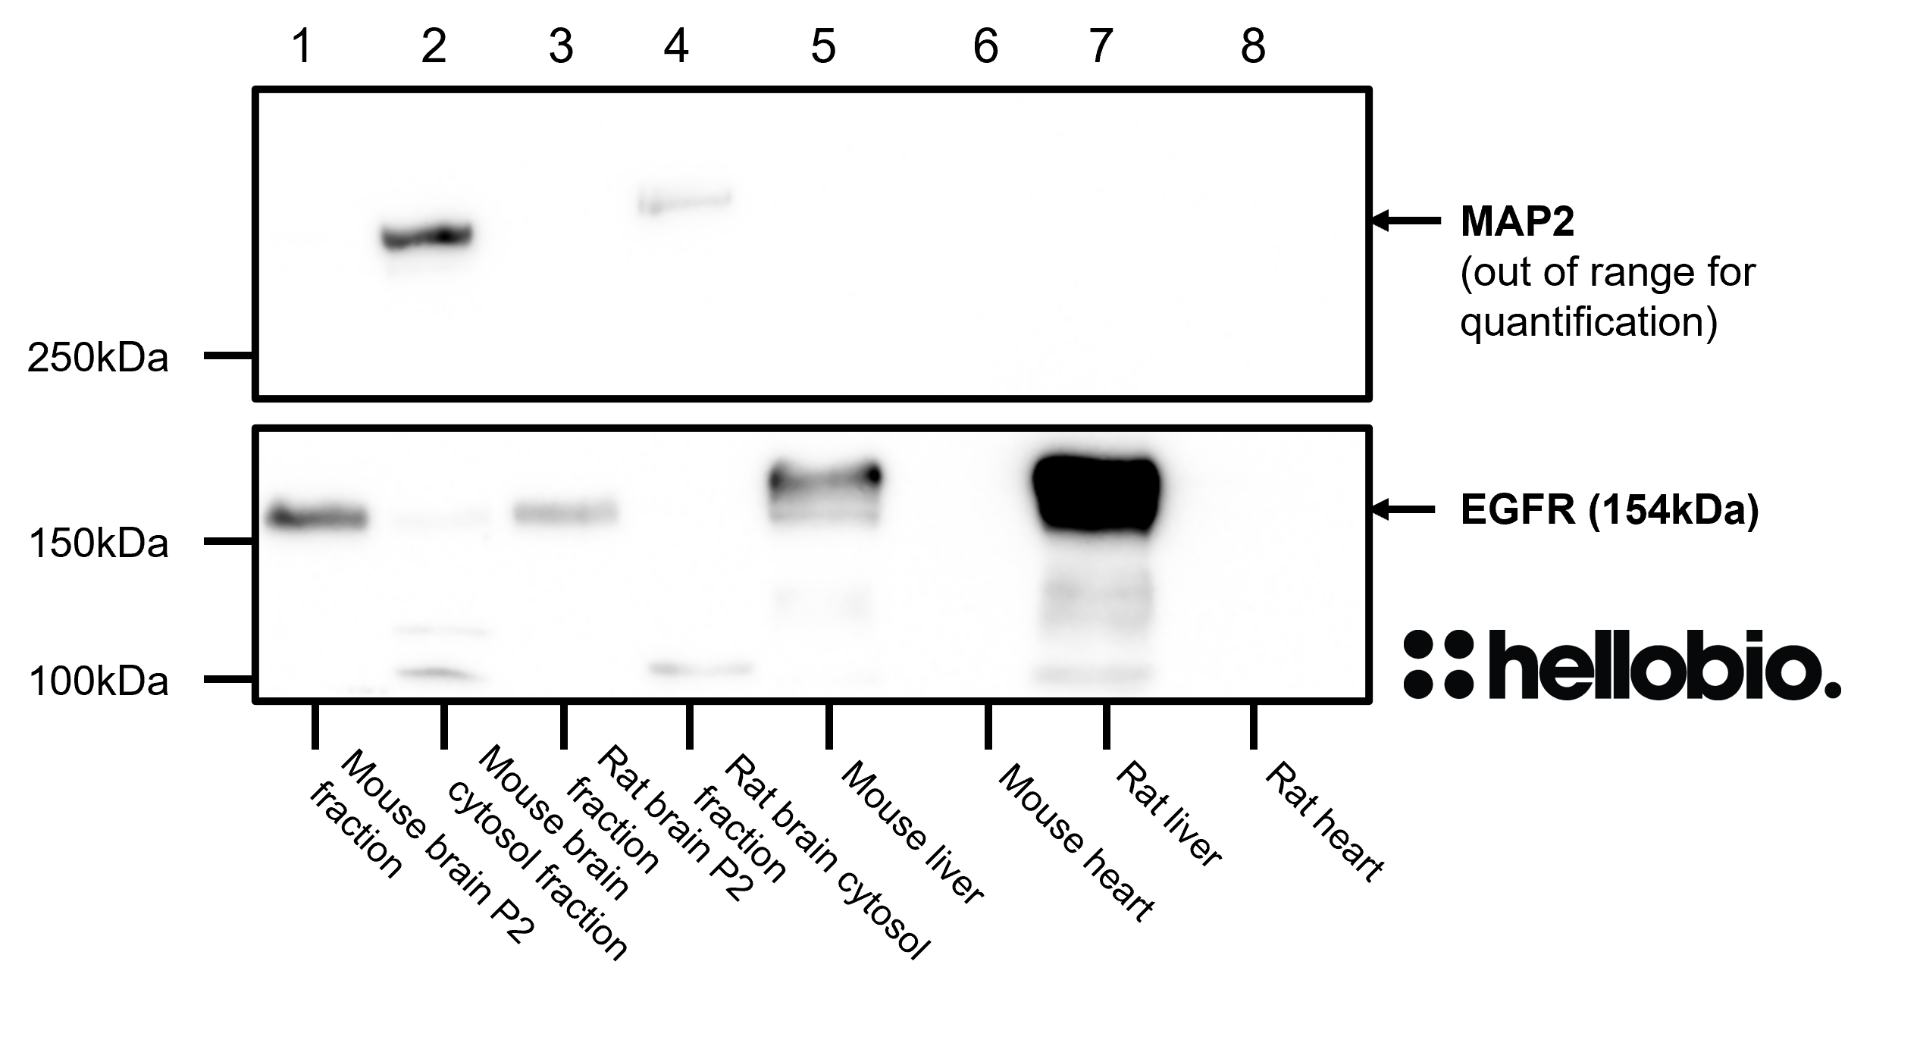
Figure 9. MAP2 and EGFR expression in various tissue lysates and preparations. HB9587 revealed a band of size greater than 250kDa only present in brain cytosol fractions whereas ab52894 (Abcam) revealed bands in P2 and liver samples. Method: mouse brain and rat brain membrane (P2) and cytosol fractions were prepared following previous work (Molnar et al., 1993. Neuroscience 53:307-326) from freshly collected adult brains. Other tissue lysates were prepared following established protocols from freshly dissected tissue (see our guide on WB sample preparation). Samples were loaded (20µg / lane) onto a 5% acrylamide gel alongside a protein ladder (BioRad Precision Plus dual colour, 1610374) before being run at 60V for 41 minutes followed by 120V for 85 minutes. Wet transfer to a PVDF membrane was completed in 93 minutes using 400mA. The membrane was blocked for 2hrs in 5% non-fat dry milk before being incubated overnight at 4°C in HB9587 at a 1:1000 dilution (1µg/ml) and ab52894 (Abcam, rabbit monoclonal) at a 1:2,000 dilution (concentration unavailable). Following washing the membrane was incubated in secondary antibodies (1:10,000 dilution of both polyclonal goat anti-mouse HRP conjugated (Sigma Aldrich A3682) and polyclonal goat anti-rabbit HRP conjugated (Sigma Aldrich A6154)) for 2hrs. For more detail please see our Western blotting protocol. Detection was accomplished using Clarity Western ECL substrate (BioRad, 1705061) and a Licor Odyssey Fc imaging system (ECL channel: 10 min exposure, 700nm channel: 30 sec exposure). |


